
Before your indicator goes on TradingView, you can see exactly what it marks on your own chart.
Choose a chart
- Add a chart file: a file exported from TradingView (paid plans), NinjaTrader or MetaTrader. If the file doesn't say which time zone its times are in, you're asked. From TradingView, turn on the Volume indicator on your chart before exporting, so your file includes volume.
- Use my broker's prices: prices from the broker you connected on the Connections page. Choose the market. If Wildflower's desktop app is open on this computer, the prices come from it. Otherwise you can sign in to ProjectX from this browser; your username and API key are used once and never saved or sent to Wildflower. ProjectX keeps about the last 14 days of prices. If your Bot is trading on that ProjectX login, open the page on the computer that runs Wildflower instead, because a second sign-in would end the Bot's.
- Try it on a practice chart: made-up prices, so you can try it straight away. It is labelled as a practice chart everywhere it appears. Free TradingView can't export chart files, so this is the way to try it on a free plan.
If your file's candles are a different size from the ones your rules use, Wildflower builds the right size from smaller candles where it can, or tells you which size to export.
A long chart can take a few seconds. While it works, the page shows how far it has got. A preview takes up to about three months of 15-second candles, so it stays quick on a phone. For more than that, export a shorter range.
Read the preview
Every setup is numbered, with a buy or sell arrow. The entry, stop and target are drawn for the five most recent setups and the one you choose, as your TradingView chart draws them. A setup's boxes end where its stop or target is reached, or just before the market's daily close at 4pm Chicago time, because that is where the Bot's trade ends. A range's high and low are drawn as flat lines from the end of the range until the end of that day. If you chose to mark the setup only, there is no stop or target, and the setup shows None for both. A gap indicator can also shade each gap it marks. Step through them with the arrows, or switch to List to see them as a table with their times and time zone. Choose a setup to see why it's there: each of your rules with the prices that met it, the stop and target in ticks, and the target as a multiple of the risk.
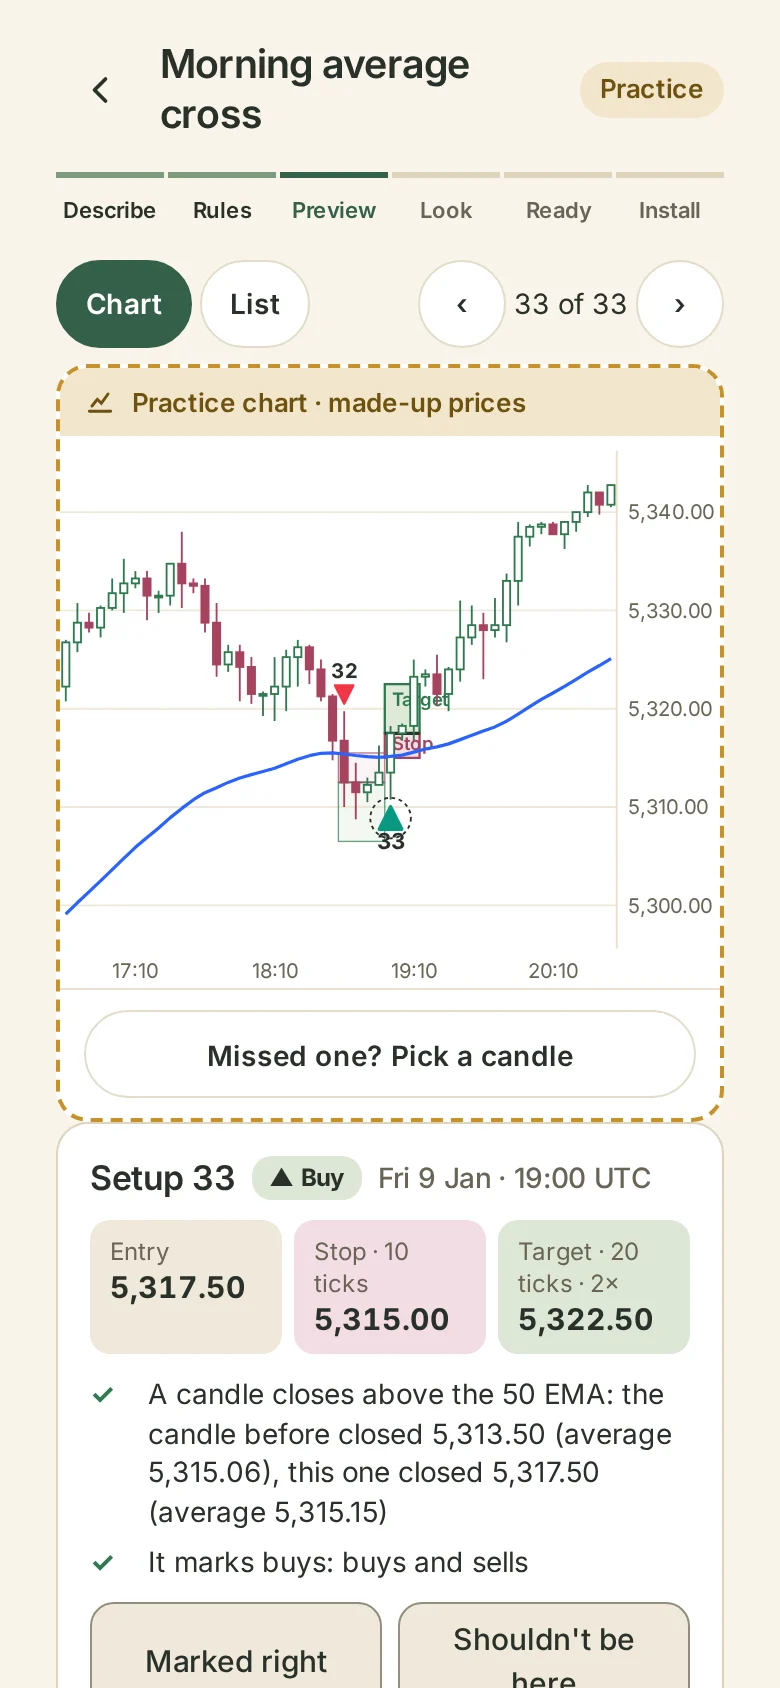
Marked right is for your own checking. Shouldn't be here takes you to change the rule that let it through.
Why is there no setup here?
Choose Pick a candle under the chart, move to the candle with the slider or your arrow keys, and choose Why no setup here? Wildflower names the rule that stopped it, with the prices. If you added conditions, a setup your rule found but a condition stopped says which condition, for example the session its candle closed in. I'd count this one takes you to change that rule.
If a chart has no setups at all, the preview shows the closest ones and the rule that stopped each.
What can go wrong
If the preview for your kind of indicator isn't available yet, it says so, and you can still get it ready for TradingView.
If your file won't open, the page says why and shows the fix: another file, the practice chart, day first or month first, or which column is which. The export steps for each platform are in Your chart file won't open.