
An indicator marks things on your chart: an arrow where your setup forms, the entry, stop and target, a line, a shaded box, an alert. You describe it in your own words and it is built from your answers. Build it free. Only pay when you add it to TradingView.
Describe it
Open Indicator in the menu (under Strategies; on a phone, tap More) to reach My indicators, and choose New indicator. Write what happens on the chart, candle by candle, when you'd want it to mark something. Rough is fine.
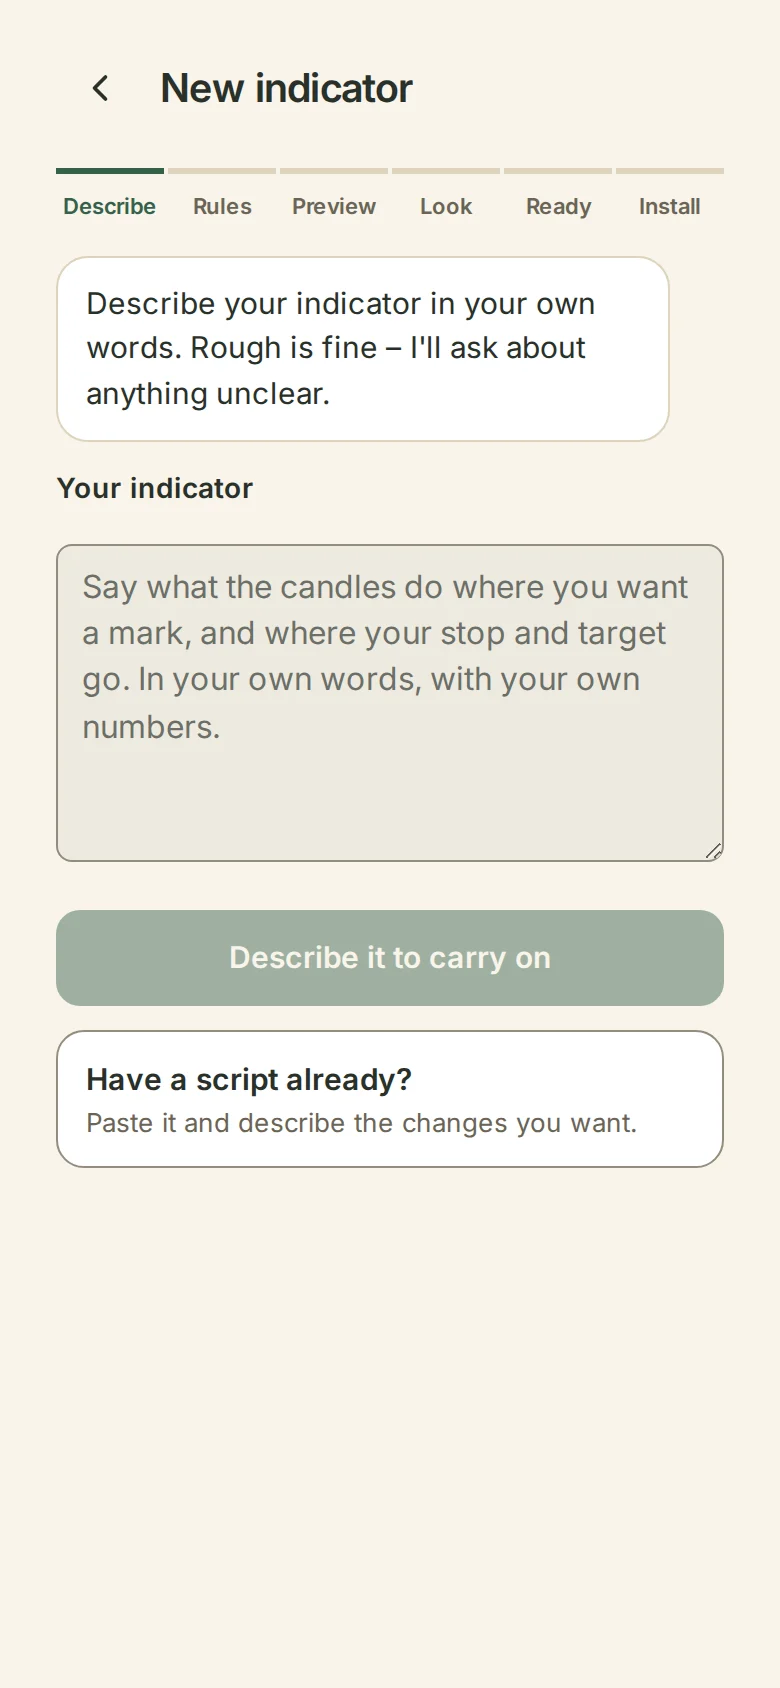
It can be built from one of these: price crossing, touching or bouncing off a moving average; two moving averages crossing; the RSI crossing levels you type; a candle reaching Bollinger bands, closing back inside them, or closing beyond them; a candle closing beyond the high or low of the candles before it, or of a time window such as an opening range; a candle pattern; or a gap across three candles in a row (often called a fair value gap). A gap is read on the candles' highs and lows: candle 1's high below candle 3's low marks a buy, and candle 1's low above candle 3's high marks a sell.
It can also be built from the Bot's own building blocks: a return into a gap by a share you type, a gap price closes through (an inverse gap), swing highs and lows, a close through a swing (a break of structure) or against the trend (a change of character), equal highs or lows, a sweep of a swing, order and breaker blocks, supply and demand zones, candles that leave earlier ones behind (expansion candles), Fibonacci retracements and extensions (above 100%) of a swing, a trendline through two swings (its break or its retest), and a retest box. You confirm how each is read and type every number.
To mark a setup only at certain times or when something else is true, see Add conditions to your indicator.
Have a script already? Choose Have a script already? and paste it. Wildflower shows its rules and settings in plain words, and lists anything in it that can't be built here yet. Describe any changes in your own words, and it asks about the rest. If it can't read the rules, describe what the script does.
Answer the questions
Wildflower asks one question at a time until your rules are exact. Anything your words already say is kept, quoted from them; everything else is asked. Numbers are typed by you, and every number field starts empty. Wildflower never picks a value for you or tells you what to use. If you ask it to decide, it says so and asks again.
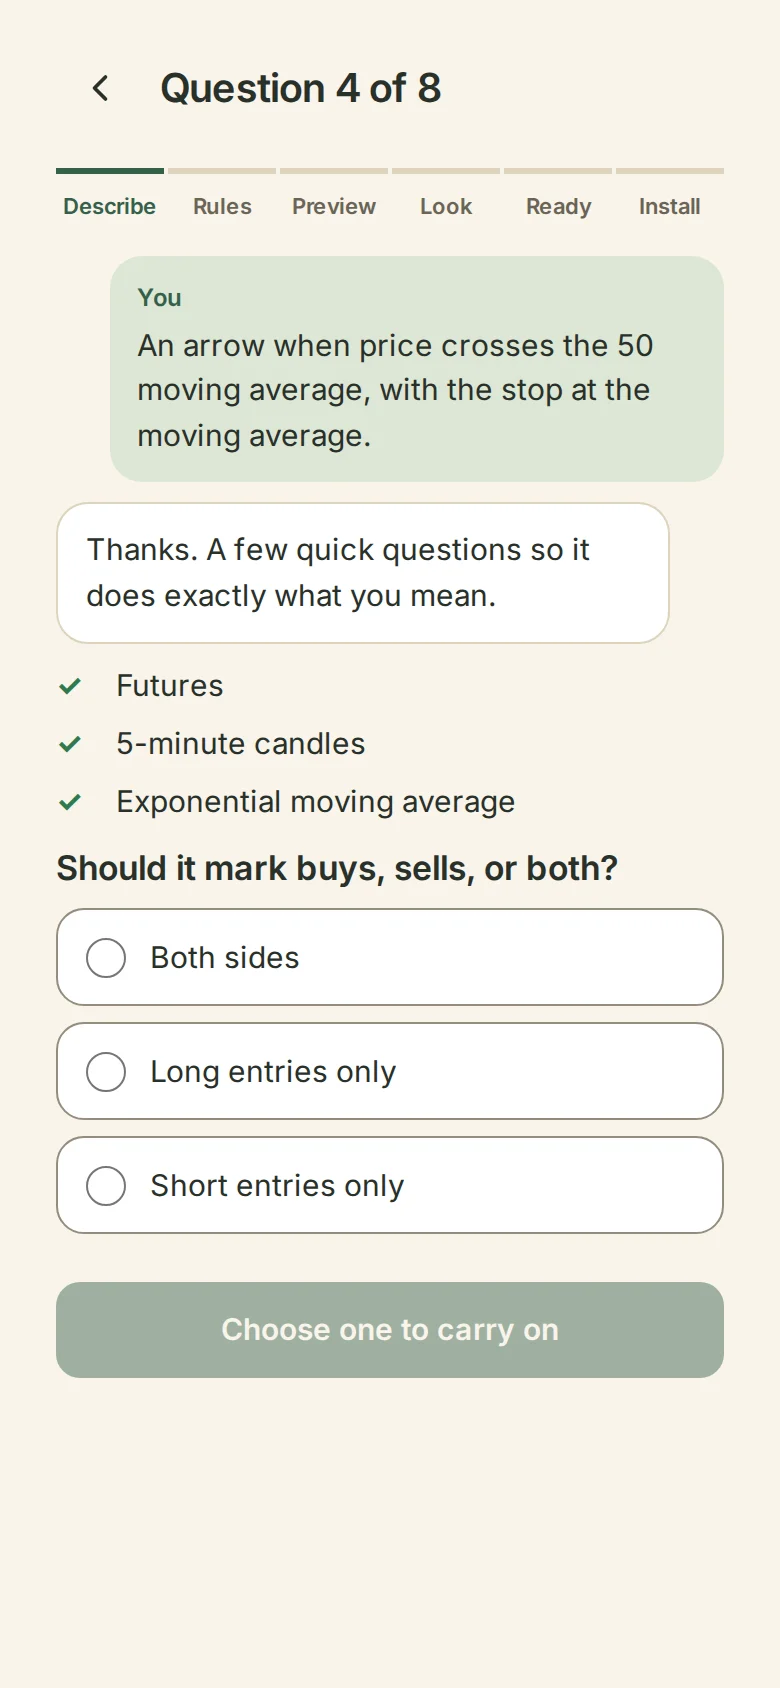
If part of what you describe can't be built yet, it says so plainly and asks whether to build the rest now or wait.
Check your rules
Check your rules reads everything back in plain words. Each rule says where it came from: your words, your answer, or both. Name your indicator in What shall we call it? Change any rule here with Change. The numbers and switches you chose are listed too. You can change them later in TradingView's settings.
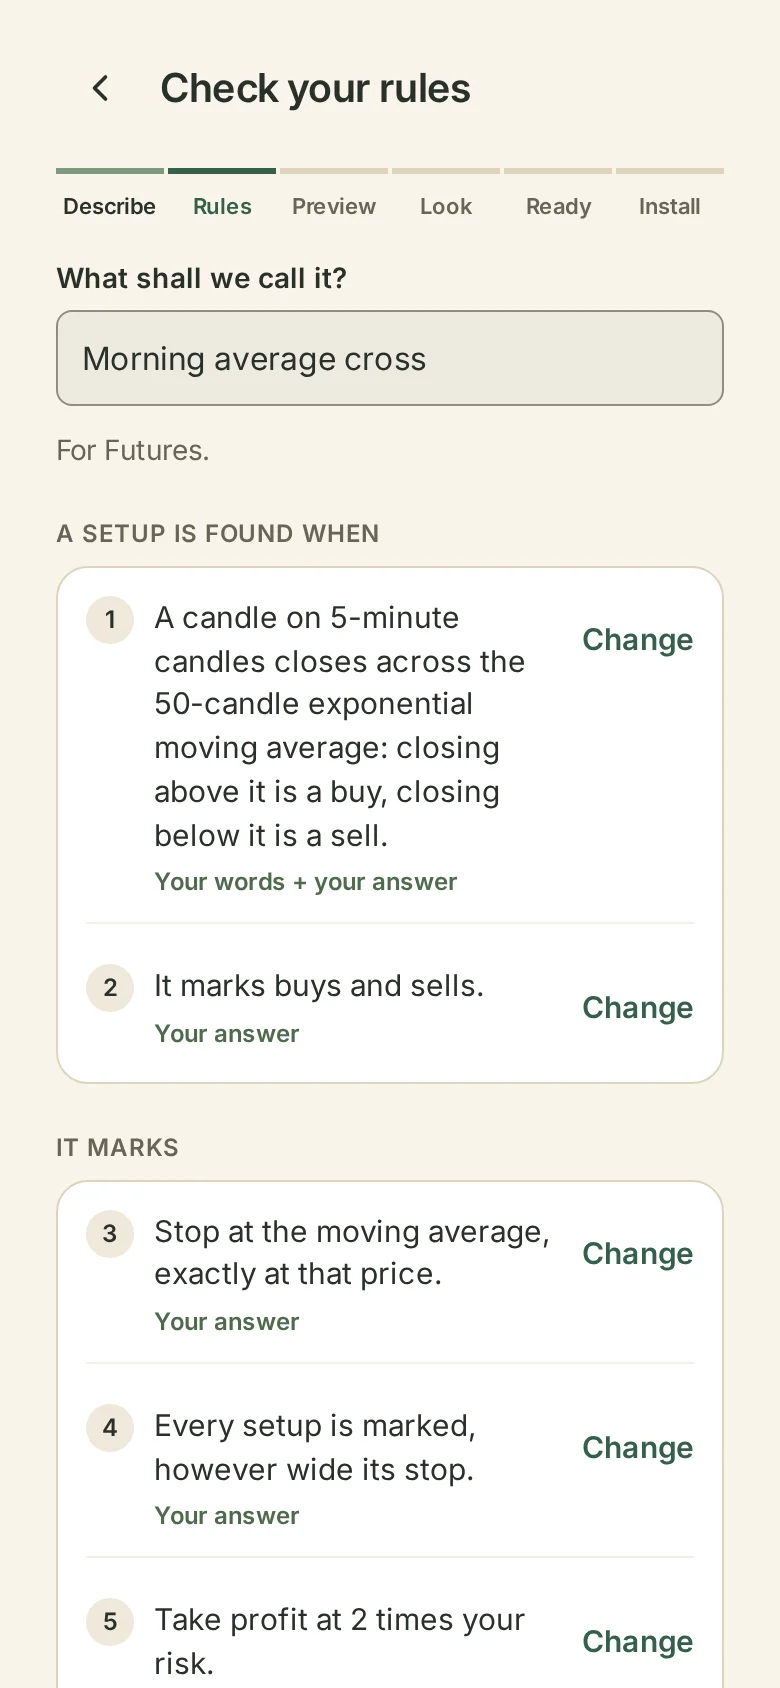
When it reads right, choose Looks right – show me on a chart.
Where it's saved
Your indicators are saved to your Wildflower account, so My indicators shows them on any device you sign in on. Saved are your description, answers, rules, settings, versions, look and the TradingView script built from them. Your chart is never saved: it stays on your device.
Rename or duplicate it
In My indicators, choose Rename, type the new name and choose Save name. Its versions all stay. TradingView shows the new name when you next add it there.
Duplicate makes a new indicator from the version you are using, with "copy" after its name. It starts at version 1, and the first one does not change.
What can go wrong
If Wildflower can't tell what your indicator should look for, it asks for more detail. Describe what happens on the chart when it should mark something.