
Moving average crossover: what it is and how to read one
By Bec, futures trader and founder of Wildflower · Updated
A moving average crossover is the moment a shorter moving average crosses a longer one. When the shorter one moves from below the longer one to above it, that’s a cross up. When it moves from above to below, that’s a cross down. It shows that recent prices have moved above or below older ones, after the move has started.
What a moving average crossover is
A The average of the last few closing prices, worked out again on every candle and drawn as a line.More in the glossary is the average of the last few closing prices, drawn as a line. A short one follows price closely. A long one moves more slowly. Read about moving averages.
Put a short one and a long one on the same chart, and they’ll cross from time to time. That moment is a The moment a shorter moving average crosses a longer one: above it for a cross up, below it for a cross down.More in the glossary. The shorter line is often called the fast average and the longer one the slow average.
When the fast average crosses above the slow one, the recent closes are, on average, higher than the older ones. When it crosses below, they’re lower. That’s all a cross measures. It’s a An indicator built from past prices, so it changes after price has already moved.More in the glossary: built from past closes, so it always comes after price has already turned.
How to spot a moving average crossover, step by step
1. Draw the fast average
Here, a 9-candle EMA, as an example.
2. Draw the slow average
Here, a 21-candle EMA. It’s smoother and further behind.
3. Compare them, candle by candle
Look for a candle where the fast line is above the slow one, after being at or below it on the candle before.
4. That candle is the cross
Here the fast line crossed above: a cross up. The mirror, from above to below, is a cross down.
Both averages are worked out from closes, so the cross is only settled when the candle closes. On a candle that’s still forming, the lines can cross and uncross several times.
Bullish and bearish crossovers
Bullish crossover. The fast average crosses above the slow one. Some traders read it as a sign that a rise has started.
Bearish crossover. The fast average crosses below the slow one. Some traders read it as a sign that a fall has started.
Golden cross and death cross. These names usually mean one pair: the 50-day and 200-day moving averages on a daily chart. A The name for the 50-day moving average crossing above the 200-day moving average on a daily chart. Some people use it for any pair.More in the glossary is the 50 crossing above the 200, and a The name for the 50-day moving average crossing below the 200-day moving average on a daily chart. Some people use it for any pair.More in the glossary is the 50 crossing below it. People sometimes use the names for any pair.
What counts, and what doesn’t
Close isn’t crossed. In the second picture, the fast line comes within a fraction of a point of the slow one and turns back. On the chart the lines look like they touch, but the fast one never gets above.
How far past. Some traders only count a cross if the fast line ends up a set distance past the slow one, in points or ticks, so a cross by a hair doesn’t count. The third picture uses a made-up rule of 0.5 points. The distance is your choice.
Closed candles. Most rules only count a cross once the candle has closed.
Same kind of average. A 9 EMA crossing a 21 SMA is a cross too, but it’s a different rule from two EMAs or two SMAs. Say which you mean.
Crossovers in a choppy market
When price moves sideways, the two lines stay close together and cross back and forth. In this stretch they cross 7 times in 36 candles. Traders call a run of crosses that quickly reverse a A run of signals that quickly reverse, such as moving averages crossing back and forth when price moves sideways.More in the glossary.
Crossovers describe trends after they start. In a market with no trend, there’s nothing for them to describe, so they flip often. Some traders add a second rule, such as the slope of a longer average, to tell the two kinds of market apart. That’s a choice, and it has its own trade-offs.
What the lengths and the type change
The lengths. Shorter lengths cross sooner and more often. Longer ones cross later and less often. You’ll often see pairs like 9 and 21, 20 and 50, or 50 and 200, but those are habits, not rules. There’s no single right pair.
The type. Two SMAs and two EMAs of the same lengths can cross on different candles, because each weighs the closes differently. In these pictures they’re two candles apart. Neither type is always first.
The timeframe. A cross on a 5-minute chart and a cross on a daily chart use the same sums but very different stretches of time.
Often confused with
Price crossing a moving average. A candle closing across one line, rather than two lines crossing each other. Read about moving averages.
MACD. The MACD line is the gap between a 12 and a 26 EMA, so it crosses zero exactly when those two averages cross. Read about MACD.
Moving average ribbon. Many averages of different lengths drawn together. Read about moving average ribbons.
A moving average crossover indicator for TradingView
Have every crossover marked, to your own rules
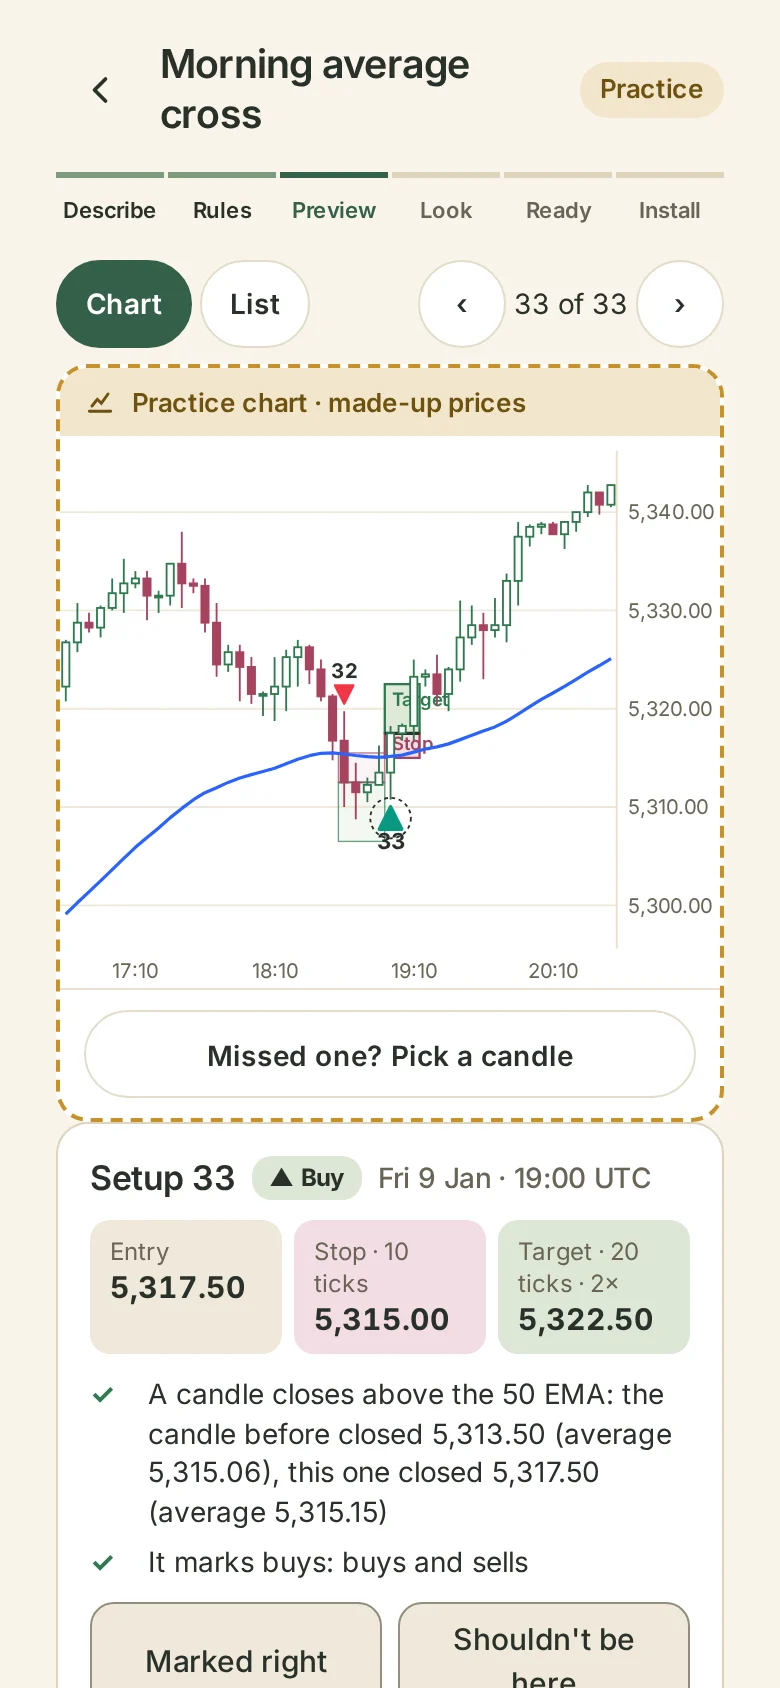
Tell Wildflower’s Indicator what you want in plain words, like “mark every candle where the shorter EMA crosses the longer one”. It asks for the two lengths, whether they’re simple or exponential, and the candle size. You type every number. It marks a cross above as a buy and a cross below as a sell, each decided when the candle closes, so you can check every one matches your rules on a chart. Then it gives you a script to add to TradingView, with a step-by-step guide.
Try it free. You only pay when you add it to TradingView.
Common questions
What is a moving average crossover?
The moment a shorter moving average crosses a longer one: above it for a cross up, below it for a cross down.
What is a golden cross?
Usually, the 50-day moving average crossing above the 200-day on a daily chart. Its opposite is the death cross.
What is a death cross?
Usually, the 50-day moving average crossing below the 200-day on a daily chart.
Which moving averages should I use for a crossover?
There’s no single right pair. You’ll often see 9 and 21, 20 and 50, or 50 and 200. The lengths are your choice.
EMA or SMA for a crossover?
Either. They can cross on different candles because they weigh closes differently. Neither is always first.
Why are moving average crossovers late?
Both lines are built from past closes, so they only cross after price has already moved.
What is a whipsaw?
A run of crosses that quickly reverse, often seen when price moves sideways. More above.
What’s the difference between a crossover and price crossing a moving average?
A crossover is two moving averages crossing each other. Price crossing a moving average is a candle closing on the other side of one line.
Is a moving average crossover a strategy?
On its own, it’s a description of two lines. A strategy also needs rules for where you get in, where you get out and how much you risk. You can test any rules you write on past prices.
Can I get a moving average crossover indicator for TradingView?
Yes. Describe your rules in plain words and Wildflower builds it. Preview it free on a chart, then pay only when you add it to TradingView. See the Indicator.