
MACD indicator: what it is and how to read it
By Bec, futures trader and founder of Wildflower · Updated
MACD (moving average convergence divergence) measures the gap between two A moving average that gives the newest closes more weight, so it reacts sooner than a simple one of the same length.More in the glossary of price. The MACD line is that gap, the signal line is an average of the MACD line, and the histogram shows the space between those two. Many charts open with lengths of 12, 26 and 9 candles, but the lengths are your choice.
What MACD measures, and why it’s called that
A The average of the last few closing prices, worked out again on every candle and drawn as a line.More in the glossary smooths price into a line. A short one follows price closely. A long one moves more slowly. MACD takes a short and a long exponential moving average and subtracts one from the other. The answer tells you how far apart they are, and which one is on top.
When the two averages pull apart, traders say they diverge, and the MACD line moves away from zero. When they come back together, they converge, and it moves towards zero. That’s the name: moving average convergence divergence. You’ll hear it said as “MAC-D”.
MACD is often grouped with An indicator drawn in its own panel that swings up and down around a middle line or between set limits, such as the RSI.More in the glossary, because it swings above and below a middle line. Unlike the RSI, it has no top or bottom. It’s measured in price points, so its size depends on the market and the timeframe.
The three parts of MACD
- The MACD line. The fast average minus the slow average. Above zero, the fast one is higher. Below zero, it’s lower.
- The signal line. An exponential moving average of the MACD line itself, so it follows the MACD line a little behind.
- The histogram. Bars showing the MACD line minus the signal line. A bar above zero means the MACD line is above the signal line.
- The zero line. Where the two price averages are equal.
How MACD is worked out, step by step
1. Draw two averages on price
A fast exponential moving average (12 candles here) and a slow one (26 candles).
2. Subtract: the MACD line
Fast average minus slow average, on every candle. Plot the answer in a panel with a zero line.
3. Average it: the signal line
Take a 9-candle exponential moving average of the MACD line.
4. The gap between them: the histogram
MACD line minus signal line, drawn as bars. When they cross, the bars flip sides.
A worked example. Take candle 68 of the 74 behind these pictures. Its 12-candle average is 105.40 and its 26-candle average is 105.19. The MACD line is 105.40 − 105.19 = 0.21. The signal line is −0.65, so the histogram is 0.21 − (−0.65) = 0.86.
12, 26 and 9 are the lengths MACD was first shown with, and most charting tools start there. They’re a starting point, not a rule. You can use any three lengths. Shorter lengths make the lines move more; longer ones make them smoother and slower. How an exponential moving average is worked out.
How to read MACD: three things traders watch
Signal line cross. The MACD line crosses its signal line. Crossing up means the MACD line has risen above its own recent average. On the histogram, it’s where the bars change sides.
Zero line cross. The MACD line goes from below zero to above, or the other way. That happens on exactly the same candle that the fast average crosses the slow one on the price chart. It’s the same event, drawn in two places.
Histogram turn. The bars grow for a few candles, then start to shrink. The gap between the MACD and signal lines has stopped widening. Some traders count how many bars moved one way before the turn, and set a smallest bar size.
Traders also look at where a cross happens. A cross up while the MACD line is still below zero is a different picture from one above zero, and some rules only count a cross on one side.
What counts as a cross, and what doesn’t
It has to change sides. The MACD line has to go from one side of the signal line to the other. On the histogram, a bar has to flip from below zero to above, or the other way. Bars getting smaller is not a cross.
Crosses can come in pairs. When the two lines run close together, they can cross and cross back within a few candles. Each one is a cross. Some traders add a rule, such as the MACD line staying past zero for a number of candles you choose.
Closed candles. While a candle is still forming, its close keeps changing, so the MACD line can cross and uncross before the candle ends. Many traders only count a cross once the candle has closed.
Timeframe changes it. A 5-minute chart and a 1-hour chart have different candles, so they have different MACD lines. A cross on one may not show on the other.
What MACD can and can’t tell you
MACD is built from averages of past closes, so it always follows price. It’s a An indicator built from past prices, so it changes after price has already moved.More in the glossary. In the pictures above, price turned up well before the MACD line reached zero. The longer the lengths, the bigger the lag.
MACD describes how two averages are moving compared with each other. It doesn’t tell you what price will do next. A cross is just a moment when two lines swapped places.
Because MACD is in price points, a reading of 2 on one market can’t be compared with 2 on another. Even on one market, the numbers get bigger when price moves more.
Where MACD comes from
MACD was created by Gerald Appel, an American money manager and author, in the late 1970s. The histogram was added in 1986 by Thomas Aspray, to show the gap between the two lines more clearly. It’s now on almost every charting platform, and works the same on futures, stocks, forex and crypto.
Often confused with
Moving average crossover. Two moving averages crossing on the price chart. A MACD zero line cross is exactly this, for the two averages MACD uses. Read about moving average crossovers.
RSI. Another momentum reading, but it’s fixed between 0 and 100 and built from gains and losses, not moving averages. Read about the RSI.
PPO (percentage price oscillator). The same idea as MACD, shown as a percentage of the slow average, so different markets can be compared.
MACD divergence. When price makes a new high or low and the MACD line doesn’t. That’s a separate idea with its own page. Read about divergence.
Marking MACD crosses on your chart
Mark the averages you choose, to your own rules
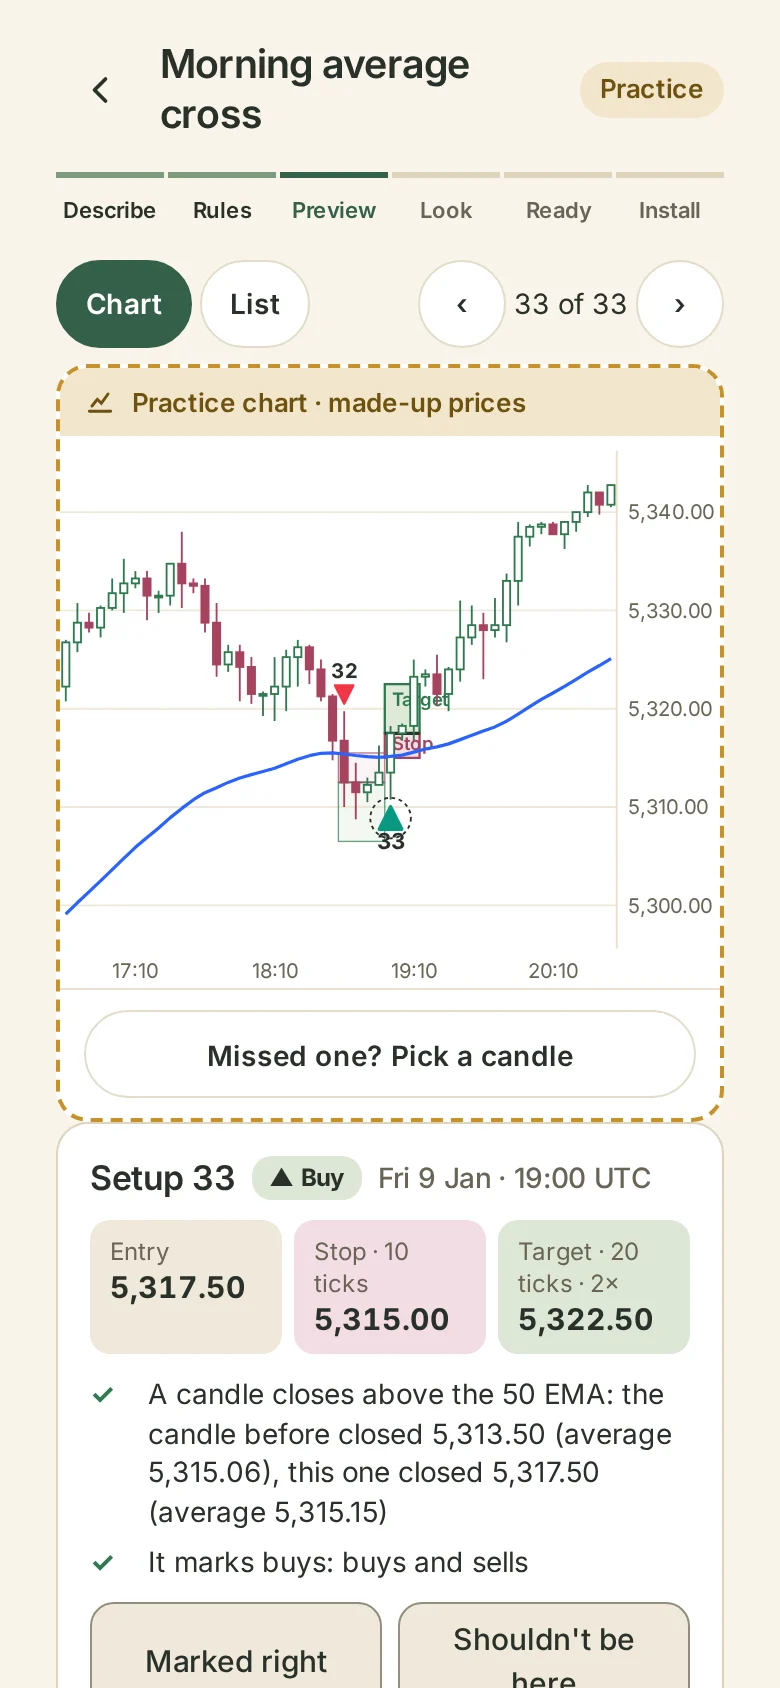
Wildflower’s Indicator marks things on a chart from rules you describe in plain words, with every number typed by you. A MACD zero line cross is the moment two exponential moving averages cross, and the Indicator can mark that: say “mark every candle where the 12-candle EMA crosses the 26-candle EMA”, with your own lengths. The signal line and histogram aren’t building blocks. If you ask for one, it tells you plainly. You can check every mark on a chart for free, then add it to TradingView with a step-by-step guide.
Try it free. You only pay when you add it to TradingView.
Common questions
What does MACD stand for?
Moving average convergence divergence.
What are the standard MACD settings?
12, 26 and 9 are the lengths MACD is usually shown with, and most charts start there. They’re a starting point, not a rule. You choose your own.
What is the MACD signal line?
A 9-candle (or your chosen length) exponential moving average of the MACD line.
What does the MACD histogram show?
The MACD line minus the signal line. Bars above zero mean the MACD line is above the signal line.
What does it mean when MACD crosses zero?
The fast average has crossed the slow average on the price chart. It happens on the same candle.
Is MACD a leading or lagging indicator?
Lagging. It’s built from averages of past prices, so it moves after price does.
Does MACD have overbought and oversold levels?
No fixed ones. It has no top or bottom, and its size depends on the market. The RSI has fixed 0 to 100 limits.
What’s the difference between MACD and RSI?
MACD compares two moving averages and is measured in price points. The RSI compares recent gains and losses and runs from 0 to 100.
Which timeframe is best for MACD?
There’s no best one. MACD can be worked out on any timeframe, and the one you watch is your choice.