
EMA vs SMA: how moving averages work and how they differ
By Bec, futures trader and founder of Wildflower · Updated
A moving average is the average of the last few closing prices, worked out again on every One bar on a price chart. It shows where price opened and closed, and the highest and lowest it reached, in one stretch of time.More in the glossary and drawn as a line. A simple moving average (SMA) counts every close the same. An exponential moving average (EMA) gives the newest closes more weight, so it turns sooner when price turns.
What a moving average is, and why it moves
Price jumps around from candle to candle. An average of the last few closes smooths those jumps into one line, so the general direction is easier to see.
It’s called a moving average because the window moves. When a new candle closes, it joins the average and the oldest one drops out. So the line is worked out again on every candle.
Every moving average has a length: how many candles it averages. A 20-candle average on a 5-minute chart covers the last 100 minutes. On a daily chart, it covers the last 20 trading days.
How a simple moving average (SMA) is worked out
1. Take the last closes
Pick a length. Here it’s 5 candles, to keep the picture small. Take their closing prices.
2. Add up and divide
100 + 102 + 101 + 104 + 103 = 510. Divide by 5: 102. That’s the average on candle 5.
3. Move along one candle
Drop the oldest close and add the newest: 102 + 101 + 104 + 103 + 106 = 516. Divide by 5: 103.2.
4. Join the dots
Do the same on every candle and join the answers. That line is the simple moving average.
Every close in the window counts the same. A close from five candles ago matters just as much as the one that just happened. When an old, very different close drops out of the window, the line can move even if the newest candle is quiet.
How an exponential moving average (EMA) is worked out
An A moving average that gives the newest closes more weight, so it reacts sooner than a simple one of the same length.More in the glossary doesn’t drop old closes. Instead, each new close pulls the line part of the way towards it. The share it moves is called the smoothing, and it comes from the length: 2 ÷ (length + 1). For a 5-candle EMA that’s 2 ÷ 6, or one third.
- Start: the first EMA value is usually the simple average of the first 5 closes: 102.
- Next close 106: move a third of the way from 102 to 106. 102 + (106 − 102) ÷ 3 = 103.33.
- Next close 108: 103.33 + (108 − 103.33) ÷ 3 = 104.89.
- Next close 107: 104.89 + (107 − 104.89) ÷ 3 = 105.59.
The newest close always has the biggest say, and older closes fade away bit by bit but never quite reach zero. That’s why an EMA turns sooner than an SMA of the same length. Some charting tools start the EMA from the first close instead of an average, so the first few values can differ slightly between platforms.
EMA vs SMA: how they differ
- Speed. With the same length, the EMA turns sooner. In the picture at the top, the EMA peaked two candles before the SMA.
- Distance from price. In a steady move, the EMA usually sits closer to price than the SMA.
- Smoothness. The SMA is often smoother, so it can show fewer small wiggles.
- Old prices. An SMA forgets a close completely once it leaves the window. An EMA keeps a small trace of every close.
Neither one is better. They describe the same prices in two different ways, and traders choose the one that fits their own rules.
What the length changes
A short average follows price closely and turns quickly. It also changes direction more often. A long average is smoother and slower, and sits further from price after a big move. The longer it is, the more it lags.
You’ll often see 9, 20, 50 and 200 used, but those are only habits. There’s no single right length. The one you use is your choice, and it will look different on each timeframe.
Price crossing a moving average: what counts
These pictures use a 5-candle average, to keep them small.
The close decides it. Most rules for price crossing an average look at where the candle closes. A wick that pokes through and comes back is not a close across. Some traders count a touch like that separately.
How far past. Some rules ask for the close to be a set distance past the line, in points or The smallest step a price can move. On many stock index futures that’s 0.25 of a point.More in the glossary, so a close just a hair past doesn’t count. The third picture uses a made-up rule of 1 point. The distance is your choice.
Closed candles. A candle that’s still forming can be above the line one second and below it the next. Many traders only count a cross once the candle has closed.
Moving average slope: rising, falling or flat
The slope is how much the average has changed over a number of candles. Take today’s value and subtract the value from 5 candles ago (or any number you choose). A positive number means it’s rising, a negative one means it’s falling, and a number close to zero means it’s flat.
Some traders only look for trades in one direction while the slope is past a size they set. The number of candles and the size are your choice, and the same size means different things on different markets.
Often confused with
Moving average crossover. Two moving averages crossing each other, rather than price crossing one. Read about moving average crossovers.
VWAP. Also an average price, but weighted by volume and started fresh each session. Read about VWAP.
Other moving averages. A weighted moving average (WMA) gives each close a fixed, falling weight. Wilder’s smoothed average (also called SMMA or RMA) is an EMA with a smoothing of 1 ÷ length, and it’s the one inside the RSI.
A moving average indicator for TradingView
Have every cross marked, to your own rules
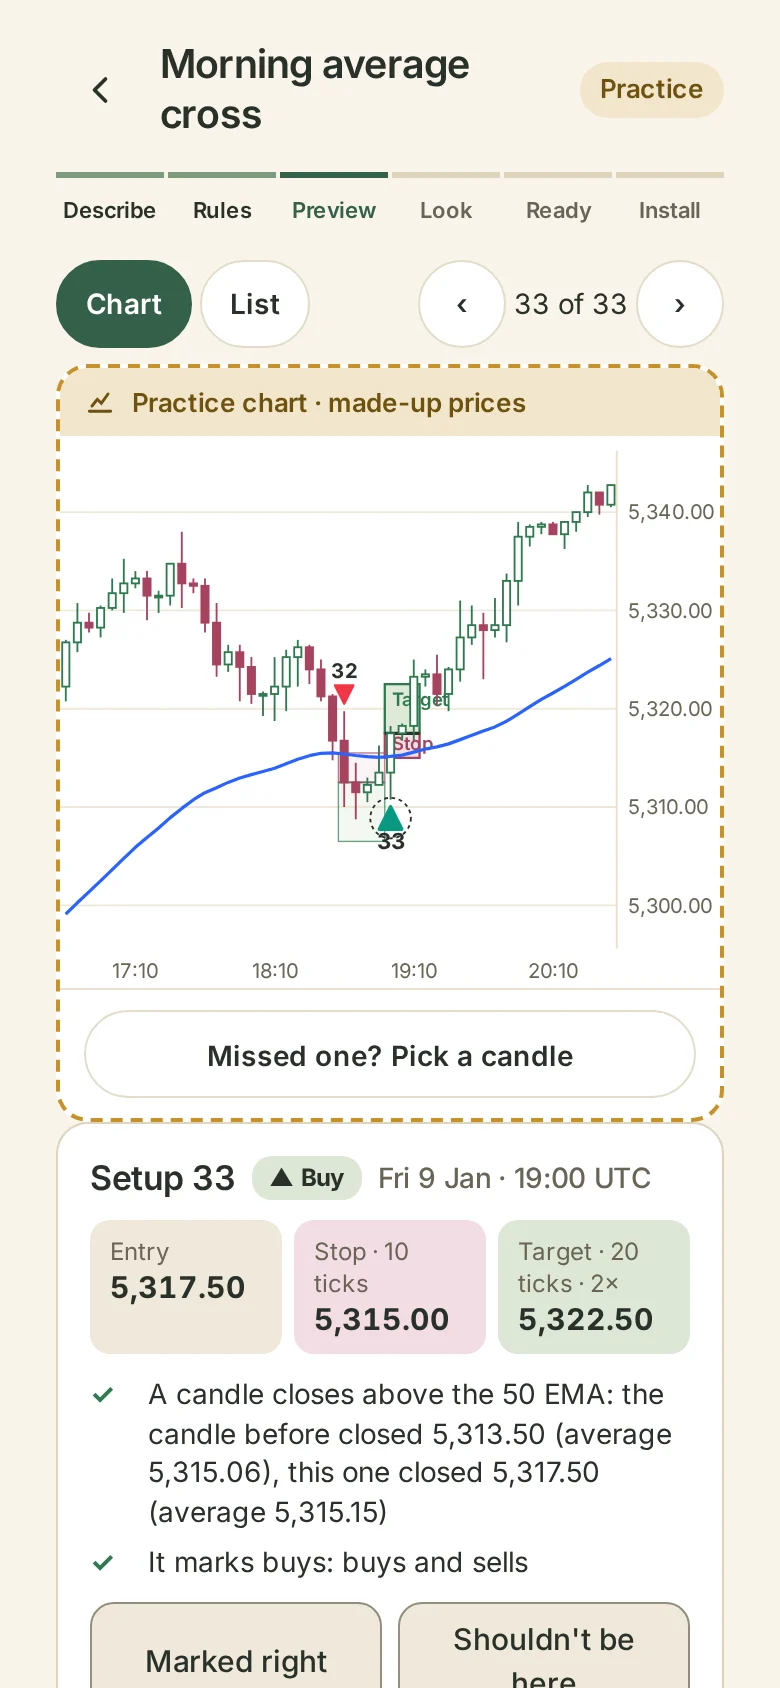
Tell Wildflower’s Indicator what you want in plain words, like “mark every candle that closes above the EMA, using the length I choose”. It can mark price crossing, touching or bouncing off a moving average, or two moving averages crossing. You type every number. It marks each one on a chart so you can check it matches your rules, then gives you a script to add to TradingView, with a step-by-step guide.
Try it free. You only pay when you add it to TradingView.
Common questions
What’s the difference between an EMA and an SMA?
An SMA counts every close in its window the same. An EMA gives newer closes more weight, so it reacts sooner.
Is EMA or SMA better?
Neither. They show the same prices in two ways. Which one you use is your choice.
How is an EMA calculated?
Each new close moves the line part of the way towards it. The share is 2 ÷ (length + 1). See the worked example.
What length of moving average should I use?
There’s no single right length. You’ll often see 9, 20, 50 and 200, but the one you use is your choice.
What does it mean when price crosses a moving average?
A candle has closed on the other side of the line. It describes what price did. It doesn’t say what happens next.
Why doesn’t my moving average match someone else’s?
Check the length, the type (SMA or EMA), the price used (usually the close) and the timeframe. EMAs can also start slightly differently on different platforms.
What is a 200-day moving average?
The average of the last 200 daily closes. It’s a very slow line that many traders watch on daily charts.
Do moving averages lag?
Yes. They’re built from past closes, so they always follow price. Longer ones lag more.
What is moving average slope?
How much the average changed over a number of candles you choose. Positive is rising, negative is falling.