
Premium and discount (ICT): what they are and how to mark them
By Bec, futures trader and founder of Wildflower · Updated
Premium and discount split a price range in half. Take a range’s high and low: the halfway point is called equilibrium, the top half is the premium and the bottom half is the discount. The terms come from ICT, and they describe where price sits in the range, not where it goes next.
What premium and discount mean
Pick a stretch of the chart with a clear high and a clear low. That’s a range. Inner Circle Trader, a trading educator whose names for chart patterns, like fair value gap, are now widely used.More in the glossary traders call it a ICT’s name for the range you measure premium and discount in, often from a swing low to a swing high.More in the glossary. Its halfway point is called In ICT’s terms, the halfway point of a range: its high plus its low, divided by two.More in the glossary.
Everything above equilibrium is the In ICT’s terms, the top half of a range, above its halfway point.More in the glossary: the higher-priced half. Everything below is the In ICT’s terms, the bottom half of a range, below its halfway point.More in the glossary: the lower-priced half. The words come from shopping: a premium price is high compared with the range, and a discount price is low.
So premium and discount aren’t patterns that form. They’re a way of labelling where price is inside a range you’ve chosen. Change the range, and the labels change with it.
How to mark premium and discount, step by step
1. Find the range
Here, a rise from a swing low to a swing high.
2. Mark its high and low
The swing high is 140 and the swing low is 100. Use the tips of the wicks.
3. Find the halfway point
Add the high and low and halve it: (140 + 100) ÷ 2 = 120. That’s equilibrium.
4. Name the halves
Above 120 is the premium. Below 120 is the discount.
Many traders draw this with a Fibonacci tool, set to show 0%, 50% and 100%. The 50% line is equilibrium. (50% isn’t a Fibonacci ratio, but most Fibonacci tools include it.) Read about Fibonacci retracement.
Premium and discount after a rise and after a fall
The premium is always the top half and the discount is always the bottom half, whichever way the range was made. What changes is which end price just came from.
In ICT’s teaching, traders who expect price to rise look for buys in the discount half of a range, and traders who expect a fall look for sells in the premium half. That’s a description of how the idea is taught, not a sign that price will turn there.
Which range to measure
There’s no single right range. These are three that traders use:
- The latest swing. From the last swing low to the last swing high, or the other way round. It changes whenever a new swing forms.
- A session. The high and low of a trading session, or of part of one, such as the first hour.
- A bigger timeframe. The previous day’s high and low, or a range on a higher timeframe chart, used on a smaller one.
A bigger range and a smaller one can disagree. Price can be in the premium of today’s range and the discount of this week’s. Read about the previous day high and low.
What counts, and what doesn’t
Below the line is discount. In the first picture, the pull back reaches 114, below 120, so it’s in the discount.
A shallow pull back isn’t. In the second, the low is 122. Price came down, but it never left the premium.
A new high moves everything. In the third, price makes a new high at 146. The range is now 100 to 146, and equilibrium moves up to 123. The old lines no longer describe the range.
Wick or close. Some traders count a wick reaching the discount, and others want a close inside it. It’s your call.
Exactly halfway. A price right on equilibrium is in neither half. Some traders treat the 50% line as its own level.
Premium, discount and other ICT ideas
ICT traders often combine premium and discount with other marks. A fair value gap or an order block that sits in the discount half of a rise is described as a “discount” gap or block. ICT’s OTE zone, a band from 62% to 79% of the way back, sits deeper inside the discount (or inside the premium, after a fall).
The term was made popular by ICT (Inner Circle Trader), a trading educator. The idea of splitting a range in half is much older, and it can be drawn the same way on any chart: futures, forex, crypto or stocks.
Often confused with
Consequent encroachment. Also a halfway point, but of a single fair value gap, not of a whole range.
Futures trading at a premium or discount. Outside ICT, “premium” and “discount” also describe a futures price above or below the spot price. That’s a different idea.
Support and resistance. Levels where price has turned before. Equilibrium is worked out from a range, not from past turns. Read about support and resistance.
Overbought and oversold. Readings from an indicator like the RSI, not halves of a price range.
A premium and discount indicator for TradingView
Have price coming back to the halfway point marked, to your own rules
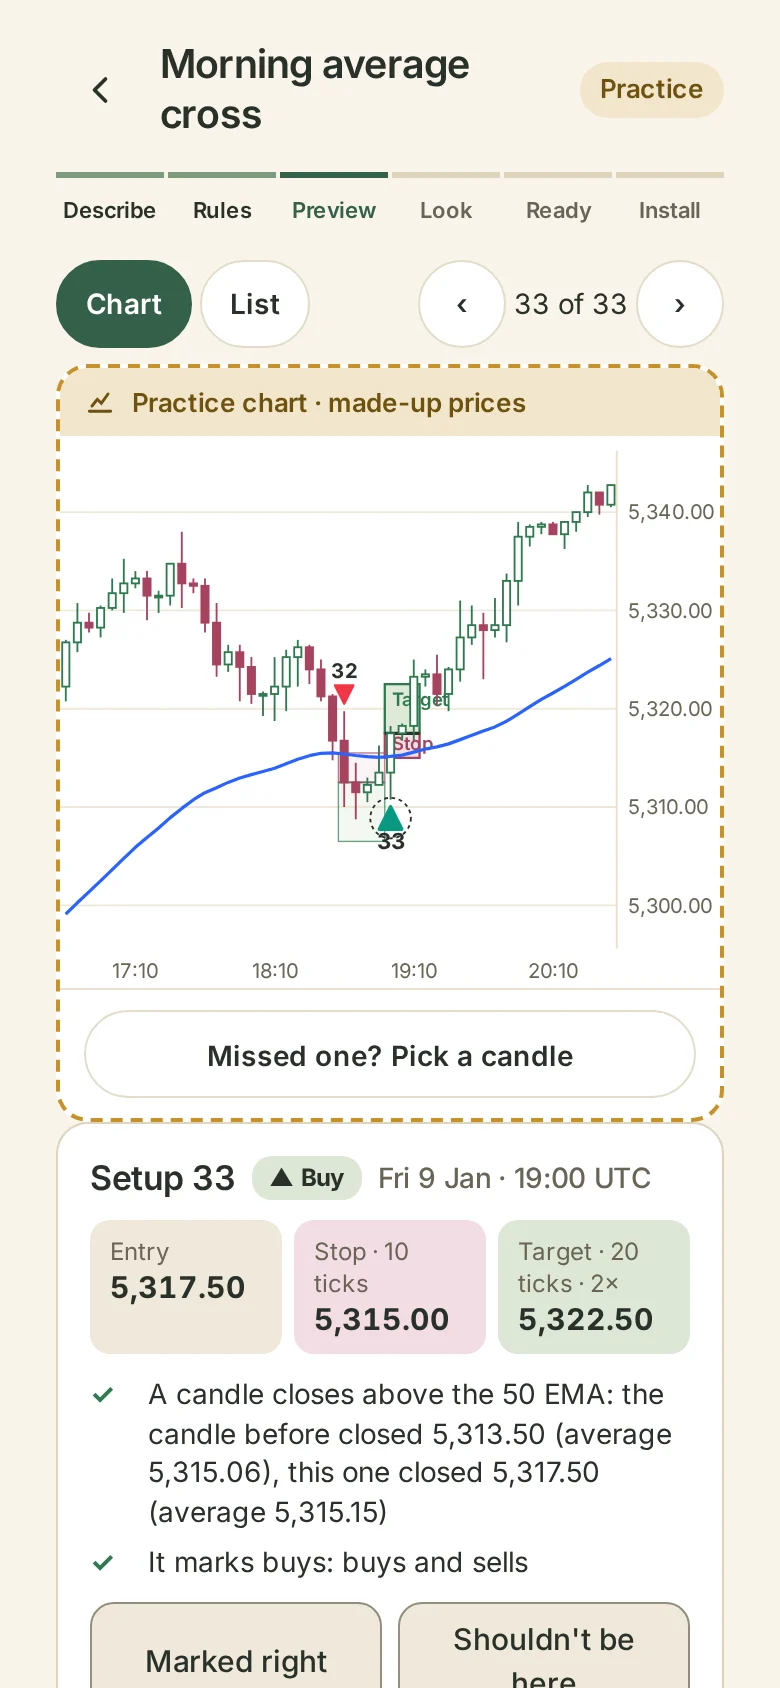
Wildflower’s Indicator doesn’t shade premium and discount zones, and it can’t use a session or the previous day as the range. What it can do is find the latest swing leg from its swing highs and lows. It then marks each time a candle’s wick reaches a percentage of the way back that you choose, such as 50%, or a band such as 50% to 100%, without closing past the far edge. You type every number, including how many candles either side make a swing. It marks each one on a chart so you can check it matches your rules, then gives you a script to add to TradingView, with a step-by-step guide.
Try it free. You only pay when you add it to TradingView.
Common questions
What are premium and discount in ICT?
The top and bottom halves of a price range. Above the halfway point is premium, below is discount.
What is equilibrium in trading?
In ICT’s terms, the halfway point of a range: its high plus its low, divided by two.
Which range should I use for premium and discount?
There’s no single right one. Traders use the latest swing, a session, or the previous day. It’s your choice.
Is discount always bullish?
No. Discount only says price is in the lower half of the range you chose. It doesn’t say what happens next.
What is a dealing range?
ICT’s name for the range you measure premium and discount in, usually from a swing low to a swing high.
Is premium and discount the same as Fibonacci?
Not quite. Many traders use a Fibonacci tool to draw it, but premium and discount only need the 50% line.
What happens to premium and discount when price makes a new high?
The range gets bigger, so its halfway point moves. More above.
What is the OTE zone?
ICT’s name for a band from 62% to 79% of the way back along a swing. After a rise, it sits inside the discount half.
Do premium and discount apply to futures?
Yes. They only need a high and a low, so they can be marked on any candle chart: futures, forex, crypto or stocks.
Can an indicator mark premium and discount?
Wildflower’s Indicator can mark price coming back to a percentage of the latest swing, such as 50%. It doesn’t shade the zones. More below.