
Equal highs and equal lows: what they are and how to spot them
By Bec, futures trader and founder of Wildflower · Updated
Equal highs are two or more A peak on the chart: a candle whose high is above the highs of the candles on both sides of it.More in the glossary at the same price, or within a few ticks of each other. Equal lows are the same with swing lows. How close counts as equal is a choice each trader makes. Traders watch them because orders are thought to gather just past them.
What equal highs and equal lows are
Price rises to a peak, falls back, then rises again and stops at almost the same price. Those two peaks are Two or more swing highs, or swing lows, at the same price or within a few ticks of each other. How close counts as equal is each trader’s choice.More in the glossary, sometimes written EQH. Two dips that stop at almost the same price are equal lows, or EQL.
“Equal” rarely means the exact same price. In the picture above, the highs are 110 and 109.75, a quarter point apart. On a market where a The smallest step a price can move. On many stock index futures that’s 0.25 of a point.More in the glossary is 0.25, that’s one tick. ICT traders often say relative equal highs, meaning close enough to count.
There can be more than two. Three or four highs lined up along the same price are still equal highs. Some traders see a longer line as more noticeable.
How to identify equal highs, step by step
1. Find a swing high
A candle whose high is above the highs of the candles on each side. Here, 2 on each side.
2. Find a later swing high
Keep going until another swing high forms. Here it’s at 109.75.
3. Compare the two prices
110 and 109.75 are 0.25 apart: one tick.
4. Mark the level
If they’re within the distance you allow, draw a line across. Those are equal highs.
For equal lows, flip it: find two A dip on the chart: a candle whose low is below the lows of the candles on both sides of it.More in the glossary and compare their lows. A swing high is only known once the candles after it have closed, so equal highs are always confirmed a few candles after the second high.
Equal highs and equal lows
Equal highs. Two or more swing highs at about the same price. Traders think of the orders above them as buy-side How easily you can buy or sell without moving the price. On charts, traders also use it for orders they think are waiting above highs and below lows.More in the glossary: stop losses on sell trades, which are buy orders, and orders waiting to buy a move higher.
Equal lows. Two or more swing lows at about the same price. Below them, traders think of sell-side liquidity: stop losses on buy trades, which are sell orders, and orders waiting to sell a move lower.
Nobody can see those orders on a normal chart. It’s a way of thinking about where they might be, not a fact about the market.
What counts as equal, and what doesn’t
How close is your choice. Some traders only count highs at exactly the same price. Others allow a few ticks. The pictures use a made-up rule of 2 ticks. There’s no single rule.
They have to be swing highs. Two candles side by side with the same high are a different, smaller pattern. Equal highs are separate peaks, with a dip between them.
A level that’s been closed through is gone. If a candle has already closed above the first high, that high no longer marks the top of anything. A later high near it isn’t matching a level that still stands.
How far back. Some traders only look for a match within a set number of candles, or within the same day. The number is yours.
Timeframe matters. Highs that look equal on a 1-hour chart may be several ticks apart on a 1-minute chart, and the other way round.
What can happen at equal highs
Swept. Price trades above the equal highs, then closes back below them. Traders call that a A quick move past an earlier high or low that then closes back inside it.More in the glossary: the idea is that it set off the orders waiting above. Read about liquidity sweeps.
Broken. A candle closes above the equal highs and price carries on. Traders call that a When price moves past a level, such as the top or bottom of a range, and keeps trading beyond it.More in the glossary.
Never reached. Price turns away before getting there. The equal highs stay on the chart until something reaches them.
Some ICT traders call obvious equal highs or lows a draw on liquidity: a price they think the market may head for. That’s an idea about where price might go, not a forecast. Equal highs can’t tell you which of these will happen.
Where the term comes from
Traders have long called two matching peaks a double top, and a price where rises keep stopping resistance. Equal highs and equal lows, and relative equal highs, are terms from Inner Circle Trader, a trading educator whose names for chart patterns, like fair value gap, are now widely used.More in the glossary and smart money concepts. They put the focus on the orders that may sit beyond the level, not on the shape.
Often confused with
Double top and double bottom. Two peaks at about the same price too, but the pattern is only complete when a candle closes below the low between them. Read about double tops and bottoms.
Tweezer tops and bottoms. Two candles next to each other with the same high or low. A candle pattern, not two separate swings. Read about tweezer tops and bottoms.
Support and resistance. A price where the market has turned before. Equal highs and lows are one way it shows up. Read about support and resistance.
Previous day high and low. Single levels from yesterday’s trading, often watched for the same reason. Read about the previous day high and low.
An equal highs and lows indicator for TradingView
Have every match marked for you, to your own rules
Checking every pair of swings by hand is slow. Wildflower’s Indicator marks each new swing high that lands within the number of ticks you type of an earlier swing high, and each new swing low the same way. You choose how many candles on each side make a swing, how many ticks apart still count as equal (zero means the exact same price), and how many candles a swing is remembered for. A swing that a later candle has closed beyond is dropped. No coding needed. It marks every match on a chart for free, then gives you a script to add to TradingView, with a step-by-step guide.
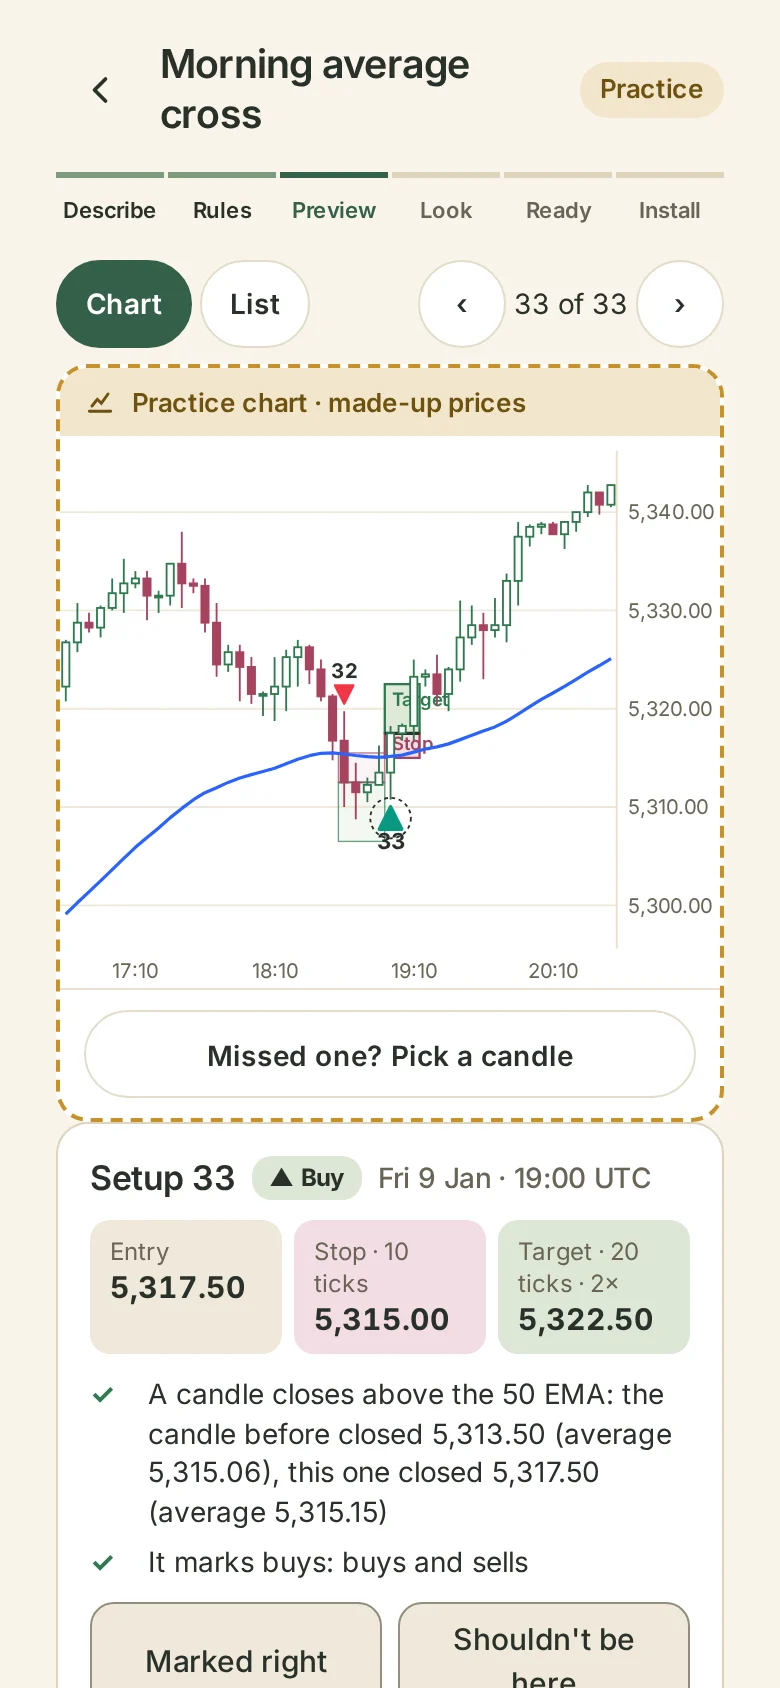
Try it free. You only pay when you add it to TradingView.
Common questions
What are equal highs in trading?
Two or more swing highs at the same price, or within a few ticks of each other.
What does EQH mean?
Equal highs. EQL means equal lows.
How close do highs have to be to count as equal?
There’s no single rule. Some traders want the exact same price, others allow a few ticks. It’s your choice.
What are relative equal highs?
An ICT term for highs that aren’t exactly the same price but are close enough to count as equal.
Why do traders watch equal highs and lows?
They think stop losses and other orders gather just past them. That’s an idea about where orders might be, not something the chart shows.
Are equal highs the same as a double top?
Not quite. A double top also needs a close below the low between the peaks. Equal highs only need the two highs.
What happens when equal highs are swept?
Price trades above them, then closes back below. Traders call it a liquidity sweep. What price does next varies.
Can there be more than two equal highs?
Yes. Three or more highs at about the same price are still equal highs.
Can I get an equal highs and lows indicator for TradingView?
Yes. Describe your rules in plain words and Wildflower builds it. Preview it free on a chart, then pay only when you add it to TradingView. See the Indicator.