
Engulfing candle: what it is and how to spot one
By Bec, futures trader and founder of Wildflower · Updated
An engulfing candle is a candle whose body completely covers the body of the candle before it, and which closes the other way. A bullish engulfing is a green candle whose body covers the red body before it. A bearish engulfing is a red candle whose body covers the green body before it.
What an engulfing candle is, and why it’s called that
An engulfing pattern is two One bar on a price chart. It shows where price opened and closed, and the highest and lowest it reached, in one stretch of time.More in the glossary side by side. The second one’s The thick part of a candle, between its open and its close.More in the glossary, the thick part between its open and close, is big enough to cover the first one’s body from end to end. To engulf means to swallow, and on the chart the second body swallows the first.
The two candles also close in opposite directions. One closed down (red) and the other closed up (green), or the other way round. The second candle is the one traders call the engulfing candle.
It’s one of the most familiar A named shape made by one or a few candles in a row, such as a doji or an engulfing candle. The name describes candles that already closed.More in the glossary. Like every pattern, the name describes a shape that has already formed. It says what the last two candles did, not what the next one will do.
How to identify an engulfing candle, step by step
1. Pick two candles in a row
Look at a candle and the one just before it, once the second has closed.
2. Mark the first body
Mark the first candle’s open and close. Ignore its wicks for now.
3. Check the second body
Its open must be at or past the first close, and its close at or past the first open.
4. Check the colours
If the body covers it and the colours are opposite, it’s an engulfing candle.
In the example, the red body runs from 104 down to 102.5. The green body runs from 102 up to 105.5. It starts below the red close and ends above the red open, so it covers the whole red body.
Some tools count a body that only matches an edge, such as a green open exactly at the red close. Others want it to go past both edges. Definitions vary, so pick one and use it every time.
Bullish and bearish engulfing
Bullish engulfing. A red candle, then a green candle whose body covers it. The green candle opens at or below the red close and closes at or above the red open. It’s often spotted after a fall.
Bearish engulfing. A green candle, then a red candle whose body covers it. The red candle opens at or above the green close and closes at or below the green open. It’s often spotted after a rise.
What counts, and what doesn’t
Bodies, not wicks. The standard rule compares bodies only. The first candle’s The thin lines above and below a candle’s body. Their tips are the highest and lowest prices in that candle.More in the glossary can stick out past the second candle, and it still counts.
Some traders want the wicks covered too. They only count it when the second candle’s high and low also reach past the first candle’s high and low. That’s a stricter rule, and it finds fewer. Both are in use, so say which one you mean.
Wicks alone aren’t enough. If the second candle’s range covers the first but its body doesn’t, that’s an A candle whose high is above the high of the candle before it and whose low is below that candle’s low.More in the glossary, not an engulfing candle.
The colours must be opposite. Two green candles, one bigger than the other, isn’t an engulfing pattern. A first candle that opens and closes at the same price (a A candle that closes at, or very close to, the price it opened at, so it has almost no body.More in the glossary) has no colour, so most rules skip it.
Size is your call. Some traders ignore engulfing candles with a body smaller than a number of The smallest step a price can move. On many stock index futures that’s 0.25 of a point.More in the glossary they choose. Others want the second body to cover more than one candle before it. There’s no single rule.
Wait for the close. Until the second candle closes, its body can still change. Many traders only count the pattern once it has closed.
Wildflower’s Indicator uses the body over body rule, counts a body that only matches an edge, and waits for the close. You can also ask for the wicks covered. A smallest body size, or a body that covers more than one candle, isn’t one of its checks. More on that below.
What can happen after an engulfing candle
Once an engulfing candle has closed, anything can follow. Price can carry on the same way, turn back through it, or drift sideways. The pattern can’t tell you which.
Where it forms. Many traders look at where the pattern sits, not just the pattern. A bullish engulfing after a long fall, at a A price area below the market where falling prices have stopped and turned up before.More in the glossary level, reads differently to them than one in the middle of a quiet range.
The high and the low. Some traders mark the engulfing candle’s high and low. They watch for a later candle to close past one of them. Others use the candle’s own close. Both are ways of describing it, not rules that it works.
Where the engulfing pattern comes from
Candlestick charts began with Japanese rice traders centuries ago. Steve Nison brought the patterns to Western traders in his 1991 book Japanese Candlestick Charting Techniques, and the engulfing pattern is one of the reversal patterns he described.
In Nison’s version, a bullish engulfing only counts after a fall, and a bearish one only after a rise. Many traders today mark every one they find and look at where it formed as a separate step. It’s read the same way on any candle chart: futures, forex, crypto or stocks.
Often confused with
Outside bar. The second candle’s high is above the first candle’s high and its low is below the first candle’s low. It compares the whole range, wicks included, and the colours don’t matter. An engulfing candle can be an outside bar too, but it doesn’t have to be. Read about outside bars.
Harami. The opposite shape: the second body sits inside the first body. Read about the harami.
Inside bar. The second candle’s whole range, wicks included, sits inside the first candle’s range. Read about inside bars.
Piercing line and dark cloud cover. Close cousins where the second candle only covers part of the first body: past its halfway point, but not all of it.
Engulfing candle indicator for TradingView
Have every engulfing candle marked, to your own rules
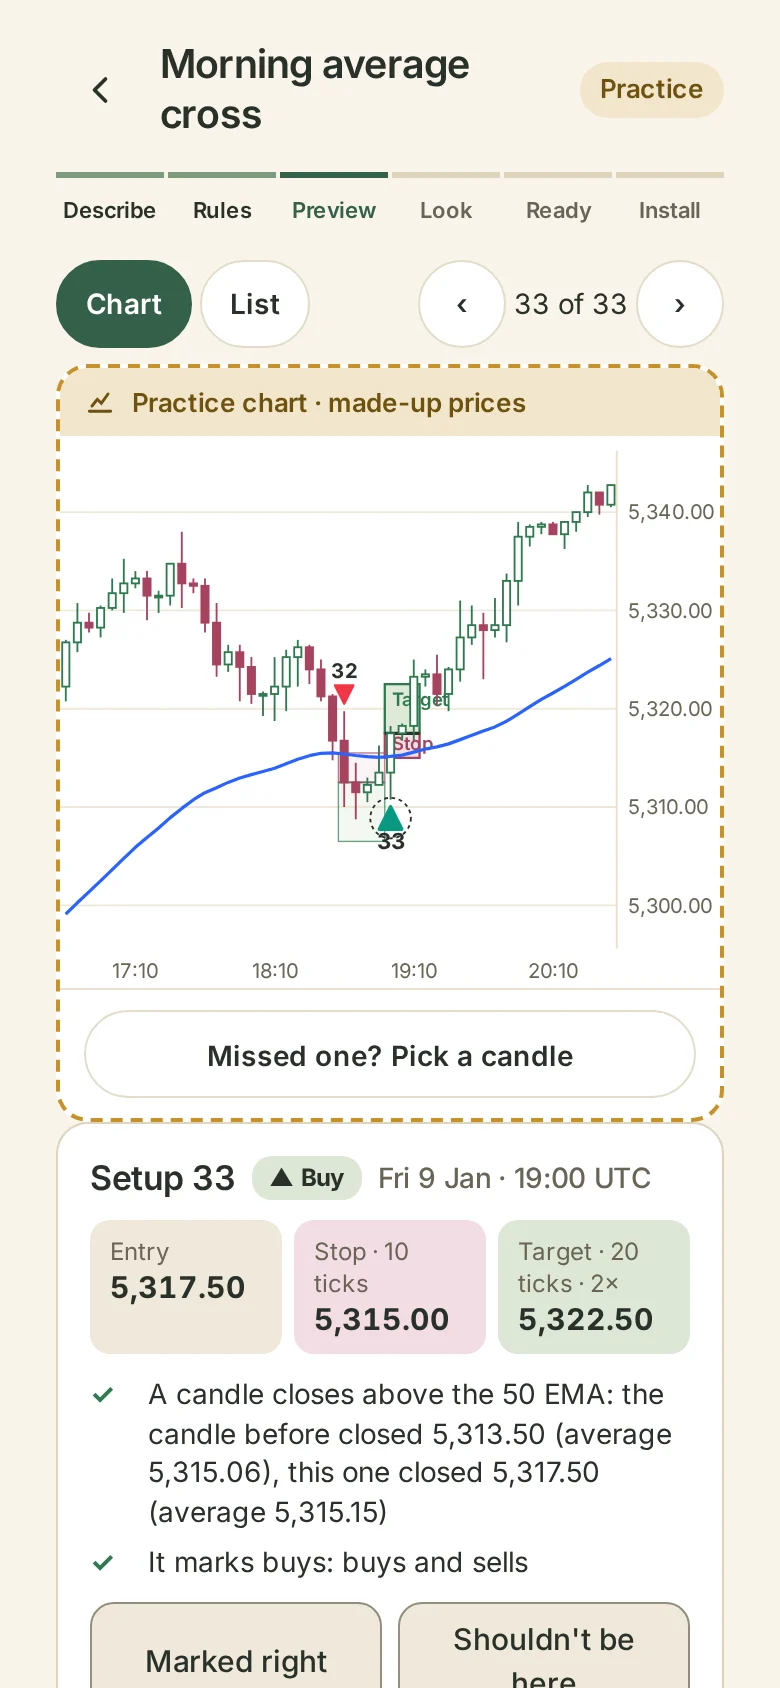
Checking every pair of candles by eye is slow, and it’s easy to miss one. Instead, tell Wildflower’s Indicator what you want in plain words, like “mark every bullish engulfing candle on the 5-minute chart”. It uses the body over body rule, and it can mark outside bars too if you also want the wicks covered. No coding needed. It marks every one on a chart so you can check it matches your rules. Then it gives you a script to add to TradingView, with a step-by-step guide.
Try it free. You only pay when you add it to TradingView.
Common questions
What is an engulfing candle?
A candle whose body covers the whole body of the candle before it, closing the other way.
What is a bullish engulfing pattern?
A red candle, then a green candle whose body covers the red body from end to end.
What is a bearish engulfing pattern?
A green candle, then a red candle whose body covers the green body from end to end.
Do the wicks have to be engulfed too?
Not on the standard rule, which compares bodies only. Some traders also want the wicks covered. Definitions vary, so say which one you use.
What’s the difference between an engulfing candle and an outside bar?
An engulfing candle compares bodies and needs opposite colours. An outside bar compares highs and lows, and colour doesn’t matter.
Does the engulfing candle need to be bigger than the first candle?
Its body does, since it has to cover the first body. Its wicks don’t.
Does an engulfing candle have to come after a trend?
In Nison’s original version, yes. Many traders now mark every one and look at the trend separately.
Which timeframe is best for engulfing candles?
There’s no best one. The pattern forms on every timeframe. The one you watch is your choice.
Is an engulfing candle a reversal signal?
It’s often listed as a reversal pattern, but it only describes two candles that already closed. Price can go either way after it.
Can I get an engulfing candle indicator for TradingView?
Yes. Describe your rules in plain words and Wildflower builds the indicator. Preview it free on a chart, then pay only when you add it to TradingView. See the Indicator.